Distance sampling: methods and applications
Additional materials
Set of data and analyses are provided on this site to complement their description found within Distance sampling: methods and applications published by Springer.
The intention of providing these case studies is to permit readers of the book to follow along with the analyses described in the book. In addition, we hope that by providing a clear description of the analysis, practicioners will be able to use the analyses we provide to form the basis for similar analyses they may wish to perform.
Some of the analyses are performed using the Windows-based Distance software (Thomas et al. 2010). For those analyses, we provide a description along with an archived Distance project in the form of a .zip file. That file can be downloaded and opened using the Distance software, available for download at distancesampling.org
Other analyses were performed using code written in the R language. R can also be freely downloaded from CRAN. For those case studies, we provide not only the data but also the code, with a description of the analysis.
Montrave songbird case study
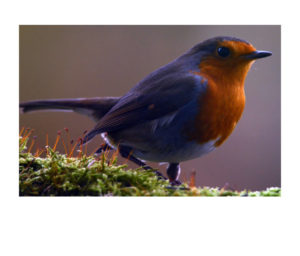
This work originally published in (Buckland 2006). Stemming from field work conducted by Prof. Buckland in 2004, this dataset featured in a number of analyses described throughout the book. Analysis of line transect data is described in Section 5.2.2.3, 5.3.2.2 and 6.3.1.4; point transect data collected via the snapshot methods is described in Section 5.2.3.3 and 6.3.2.3; and cue counting data analysis is described in Section 9.4.2.
Distance GUI analysis
- Narrative
- Distance projects (zip files to open in Distance)
R-based analysis
- Narrative
- HTML format
- PDF format
- R Markdown source (unzip to access .rmd file)
- R code extracted from Rmd (unzip to acces .r file)
- Data
- Line transect data (unzip to access .csv file)
- Point transect snapshot (unzip to access .csv file)
Survey design simulation case study
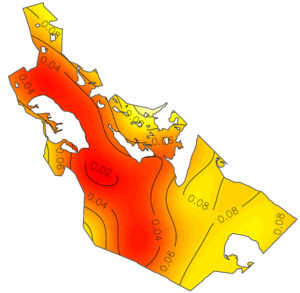
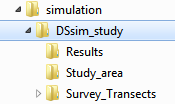
This case study uses the R package DSsim as well as in Version 7 of Distance. Simulation results are described in Section 2.5.2.
- Narrative
- HTML format
- PDF format
- R Markdown source (unzip to access .rmd file)
- R code extracted from Rmd (unzip to access .r file)
- Data
- Data resides in multiple directories and should follow a specific directory structure. Extract data from this zip archive file to create the directory structure shown at right for use with the R code provided. The *.Rmd file is assumed to reside in the directory named
simulationin the figure at right.
- Data resides in multiple directories and should follow a specific directory structure. Extract data from this zip archive file to create the directory structure shown at right for use with the R code provided. The *.Rmd file is assumed to reside in the directory named
Cork oak simulation
Results shown in Section 5.2.2.3… (to appear)
Crossbill lure case study
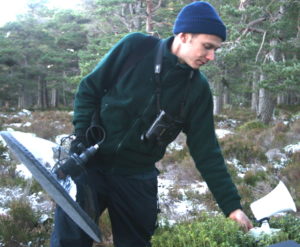 This is work originally published in (Summers and Buckland 2011). This case study using lures to attract Scotland’s only endemic bird species, is described in Section 9.2.1.
- Narrative
- HTML format
- PDF format
- R Markdown source (unzip to access .rmd file)
- R code extracted from Rmd (unzip to access .r file)
- Data
- Lure trial data (csv) (unzip to access .csv file)
- Main survey data(csv) (unzip to access .csv file)
Hawaiian Amakihi case study
 This work originally published in (Marques et al. 2007). The purpose of this case study was to employ covariates in the detection function. That analysis is discussed in Section 5.3.2.1.
- Narrative
- HTMLformat
- PDF format
- R Markdown source (unzip to access .rmd file)
- R code extracted from Rmd (unzip to acces .r file)
- Data
- amakihi sightings file (csv) (unzip to access .csv file)
- Data for use with Distance GUI found in amakihi.zip distributed with Distance
Northern bobwhite quail
This is work originally published in (Oedekoven et al. 2013). This study is an example not only of analysis of a designed experiment, intended to examine the effect of a management action upon bird density; but also taking into account spatial dependence among sampling locations. It is discussed in Section 8.5.2 of the book.
Pantropical spotted dolphins
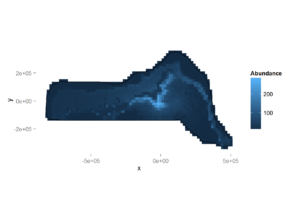 This is work originally published in (Miller et al. 2013). This case study describes a model-based approach to the extrapolation of animal density from the covered region to the study area. It is discussed in Section 7.4.2.
- Narrative
- Data
- Data for the R code is contained inside the
dsmpackage, nothing else to download - Data for use with Distance GUI found in dolphins.zip distributed with Distance
- Data for the R code is contained inside the
References
Buckland, S. T. 2006. Point transect surveys for songbirds: Robust methodologies. The Auk 123:345–357.
Marques, T. A., L. Thomas, S. G. Fancy, and S. T. Buckland. 2007. Improving estimates of bird density using multiple covariate distance sampling. The Auk 124:1229–1243.
Miller, D. L., M. L. Burt, E. A. Rexstad, and L. Thomas. 2013. Spatial models for distance sampling data: Recent developments and future directions. Methods in Ecology and Evolution 4:1001–1010.
Oedekoven, C. S., S. T. Buckland, M. L. Mackenzie, K. O. Evans, and L. W. Burger. 2013. Improving distance sampling: Accounting for covariates and non-independency between sampled sites. Journal of Applied Ecology 50:786–793.
Summers, R. W., and S. T. Buckland. 2011. A first survey of the global population size and distribution of the Scottish Crossbill loxia scotica. Bird Conservation International 21:186–198.
Thomas, L., S. T. Buckland, E. A. Rexstad, J. L. Laake, S. Strindberg, S. L. Hedley, J. R. Bishop, T. A. Marques, and K. P. Burnham. 2010. Distance software: Design and analysis of distance sampling surveys for estimating population size. Journal of Applied Ecology 47:5–14.

